
Reports & insights
See what your marketing is bringing back
Every referral, visit and dollar becomes a clear report you can read in seconds — so you always know which relationships pay off, what your team is doing in the field, and where to spend next.
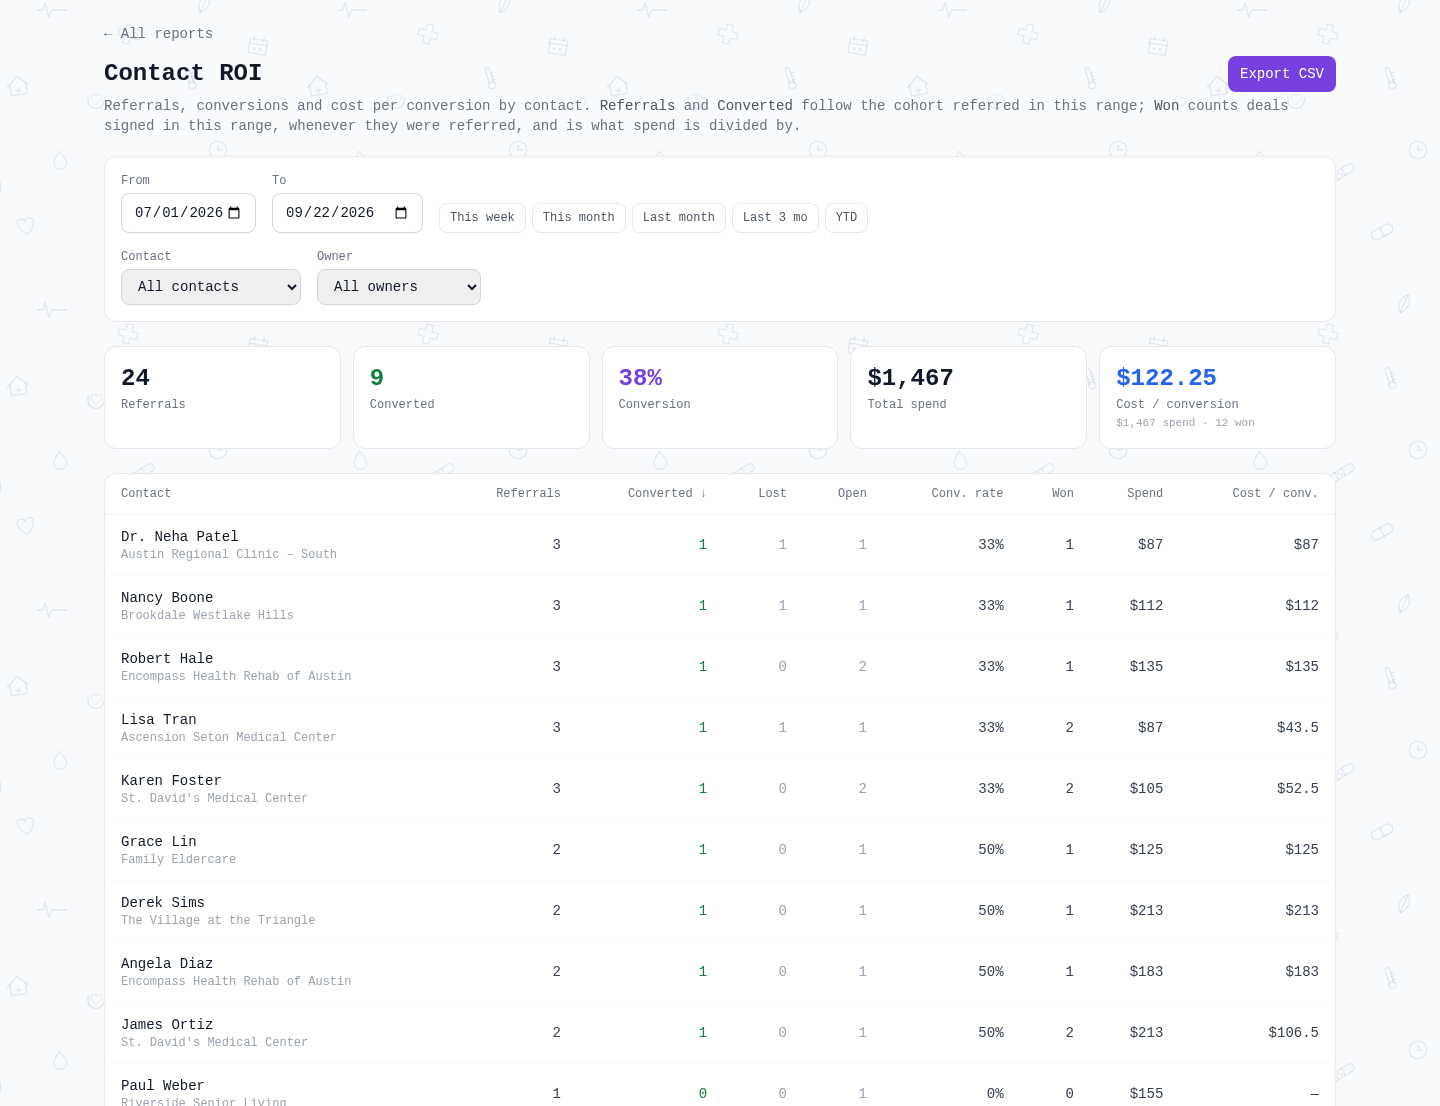
Contact ROI
Which relationships actually pay off
For every person who sends you referrals, see how many became clients and what each conversion cost you. No spreadsheets, no guessing — just a straight answer to “is this relationship worth my time?”
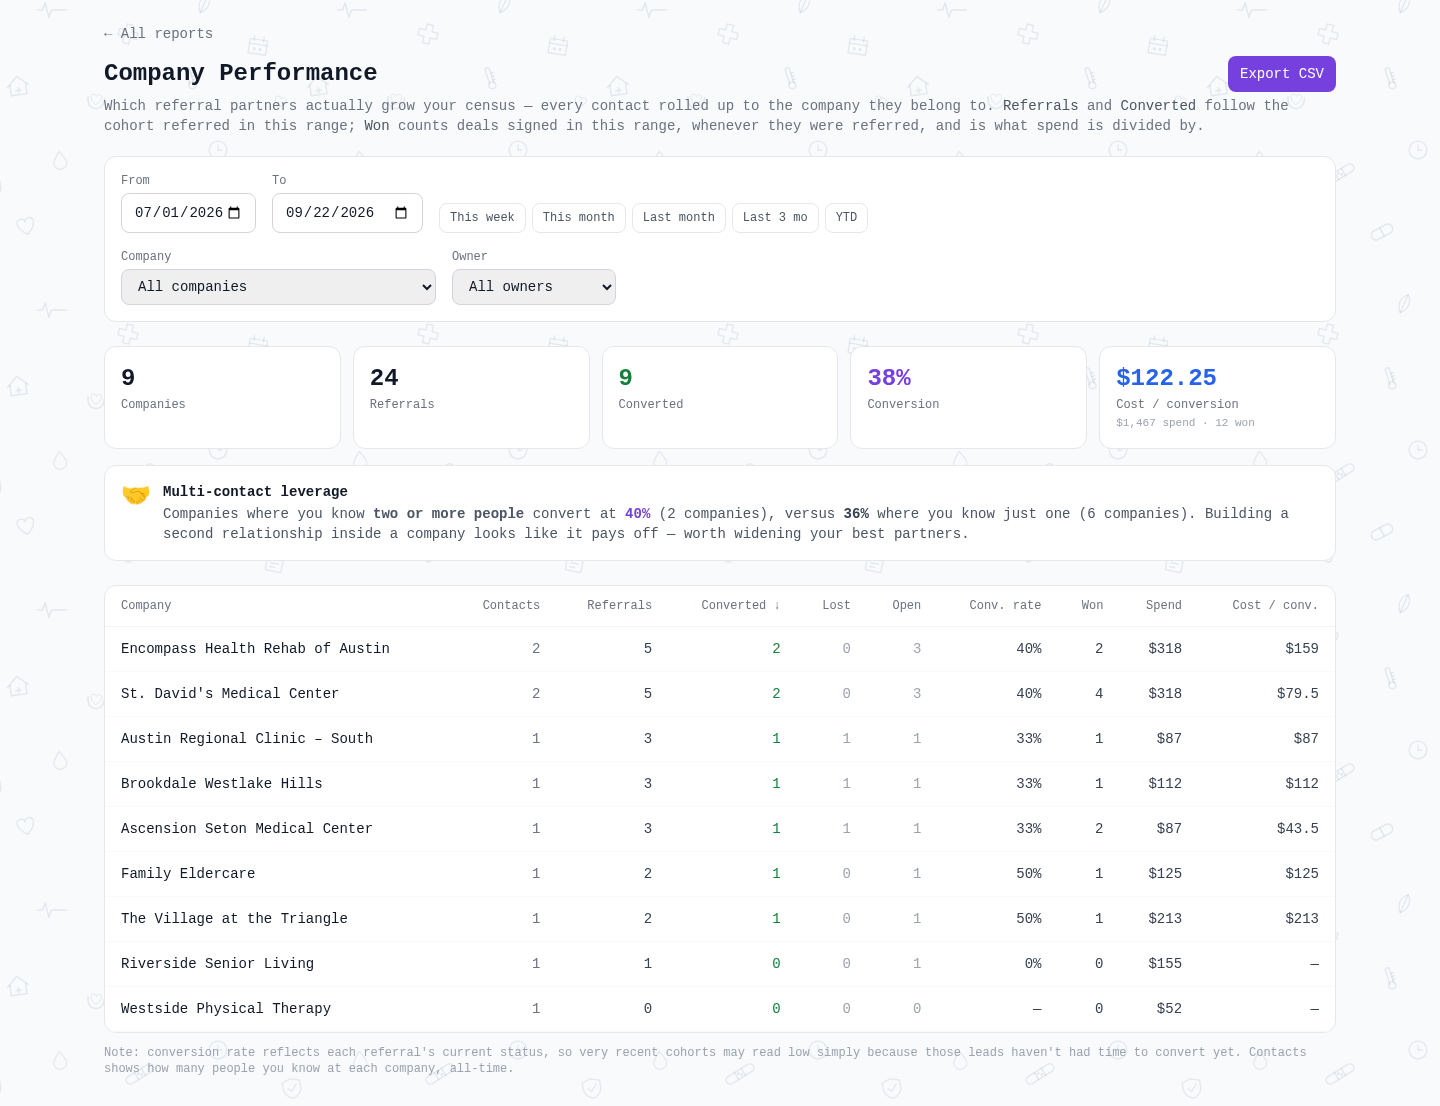
Company Performance
The referral partners worth your time
Roll every contact up to the facility, hospital or practice they belong to, and see which organizations send the most business. Spot the partners where a second or third relationship would pay off.
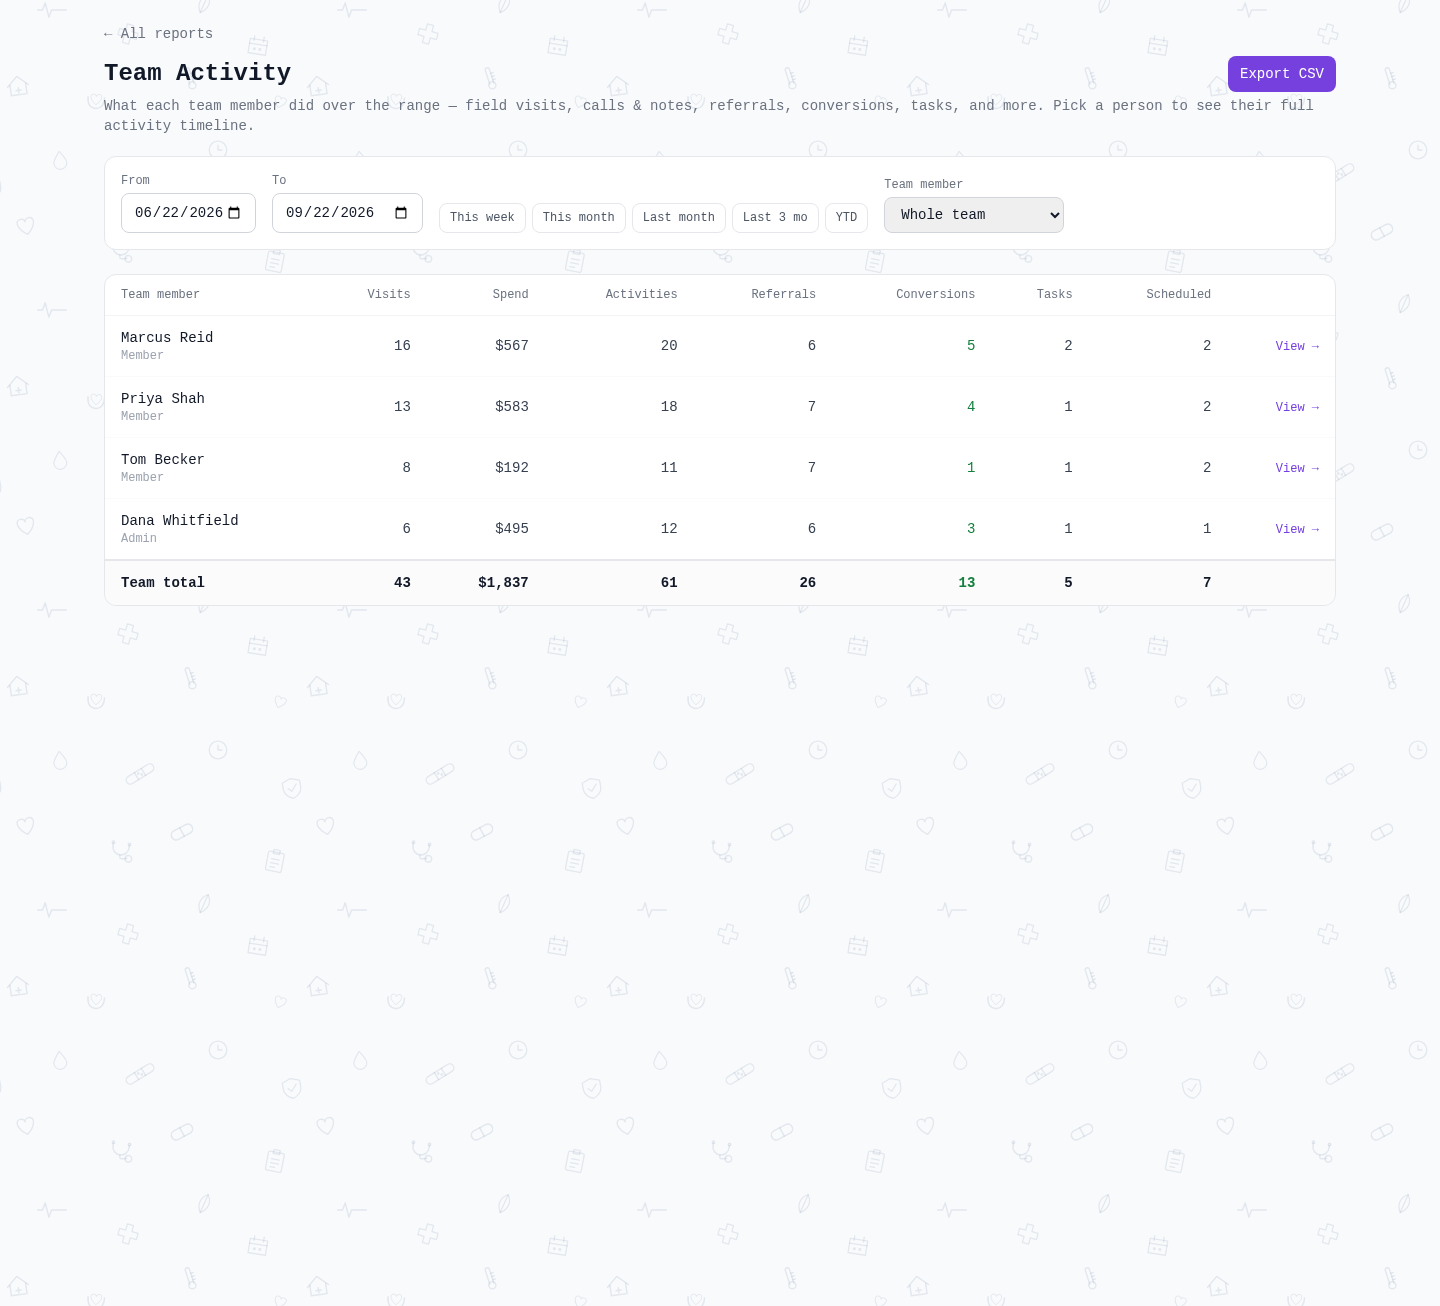
Team Activity
See what your marketers do in the field
Your community liaison is usually your single biggest marketing expense — and the hardest to see. This gives you one line per person: visits made, dollars spent, referrals brought in and clients won.
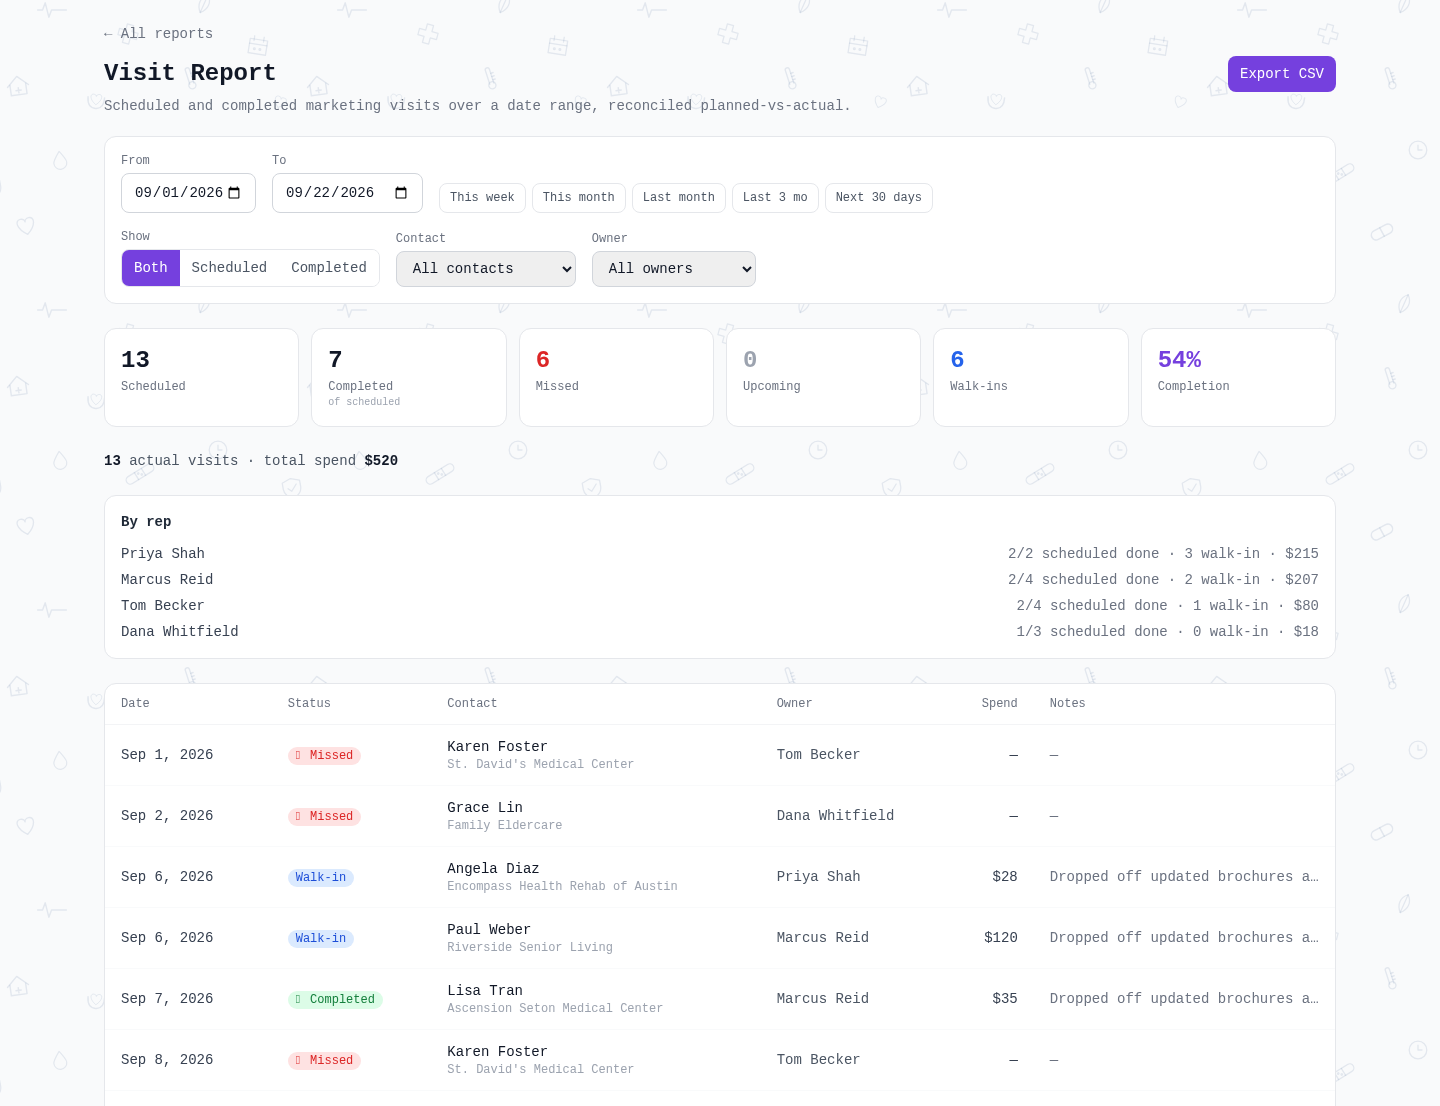
Visit Report
Which visits actually happened
Schedule field visits and ReferaCare tracks them against what really got done. Completed visits count; missed ones surface on their own, with a completion rate for each rep over any range.
Every report exports to CSV
Pull any report over any date range and download it with one click — ready to drop into a board update, a payroll review, or a conversation with a referral partner.
See these reports on your own referrals
Start a free trial or book a 30-minute walkthrough — we'll show you the numbers your agency is already sitting on.
No credit card required · Cancel any time